January 22, 2020
Jacob Bradt and Carolyn Kousky
This is part II of a two-part series.
Out of all natural disasters in the United States, floods are responsible for the most damage. To ensure sufficient funding for repair and rebuilding post-flood, households need flood insurance. At the beginning of last summer, FEMA released a wealth of historical data on flood insurance in the United States. In these two blog posts, we offer four initial insights from the microdata and discuss the policy implications of these findings. The first two were presented in a previous post:
1. Disaster losses are spiky.
2. The number of claims and claim value are both increasing over time.
Here, we present our last two findings.
3. Coastal risk dominates the program.
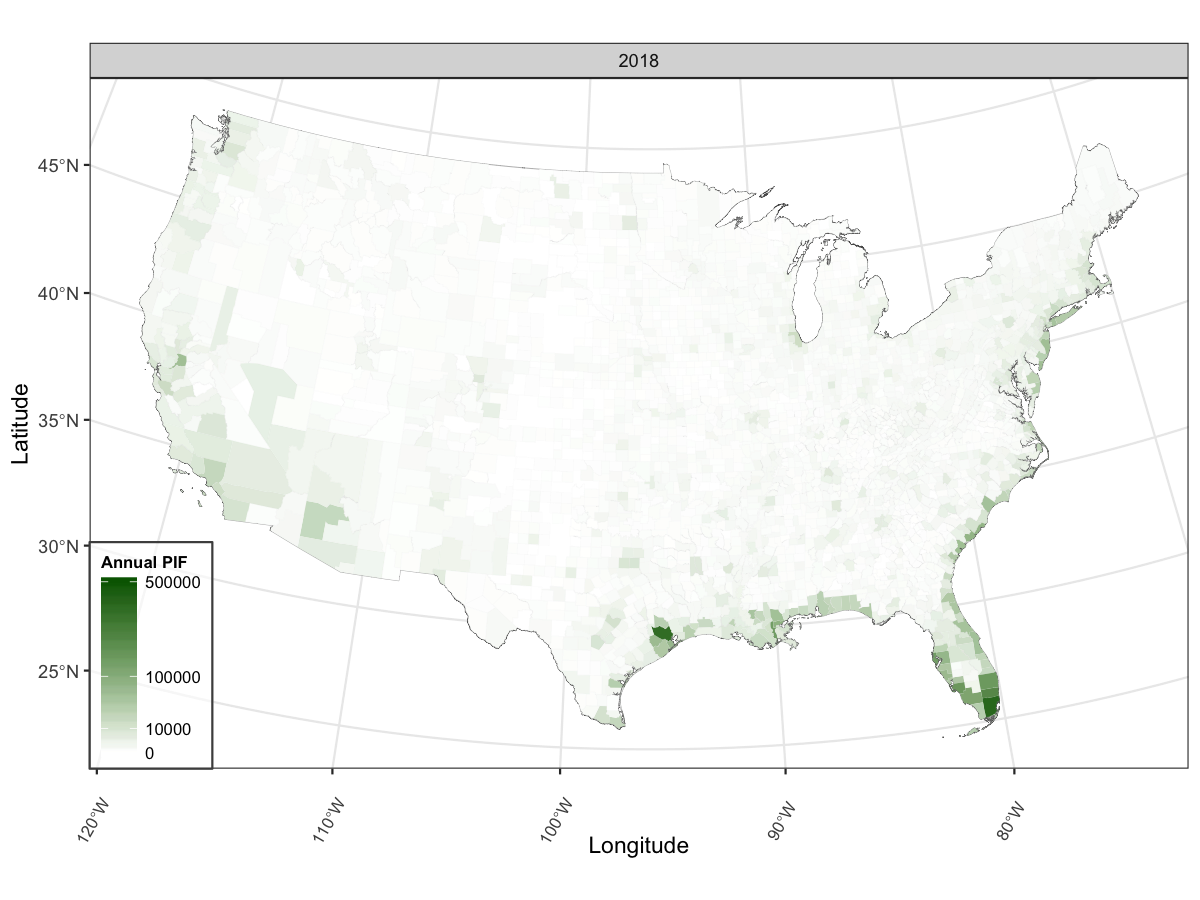
Coastal areas account for a significant portion of the National Flood Insurance Program. The majority of policies in the program are concentrated in coastal states and coastal counties. In 2018, Florida, Texas, and Louisiana accounted for almost 60% of all policies nationwide, with 35% (1.9 million policies) in Florida, 14% (0.81 million policies) in Texas, and 10% (0.57 million policies) in New Jersey. As shown in the figure below, the counties with many policies tend, with a few exceptions, to be along the hurricane-prone coast.
Largely driven by this heavy concentration of policies, but also by coastal flood events, claims paid in coastal counties account for the majority of payments. This is shown in the figure below: in all but a few years, the share of claims paid in coastal locations is over half of all claims paid and, in many years, coastal claims account for over 75% of claims paid. In the severe hurricane years of 2005, 2012, and 2017, coastal claims account for 96%, 98%, and 91% of total claims payments, respectively.
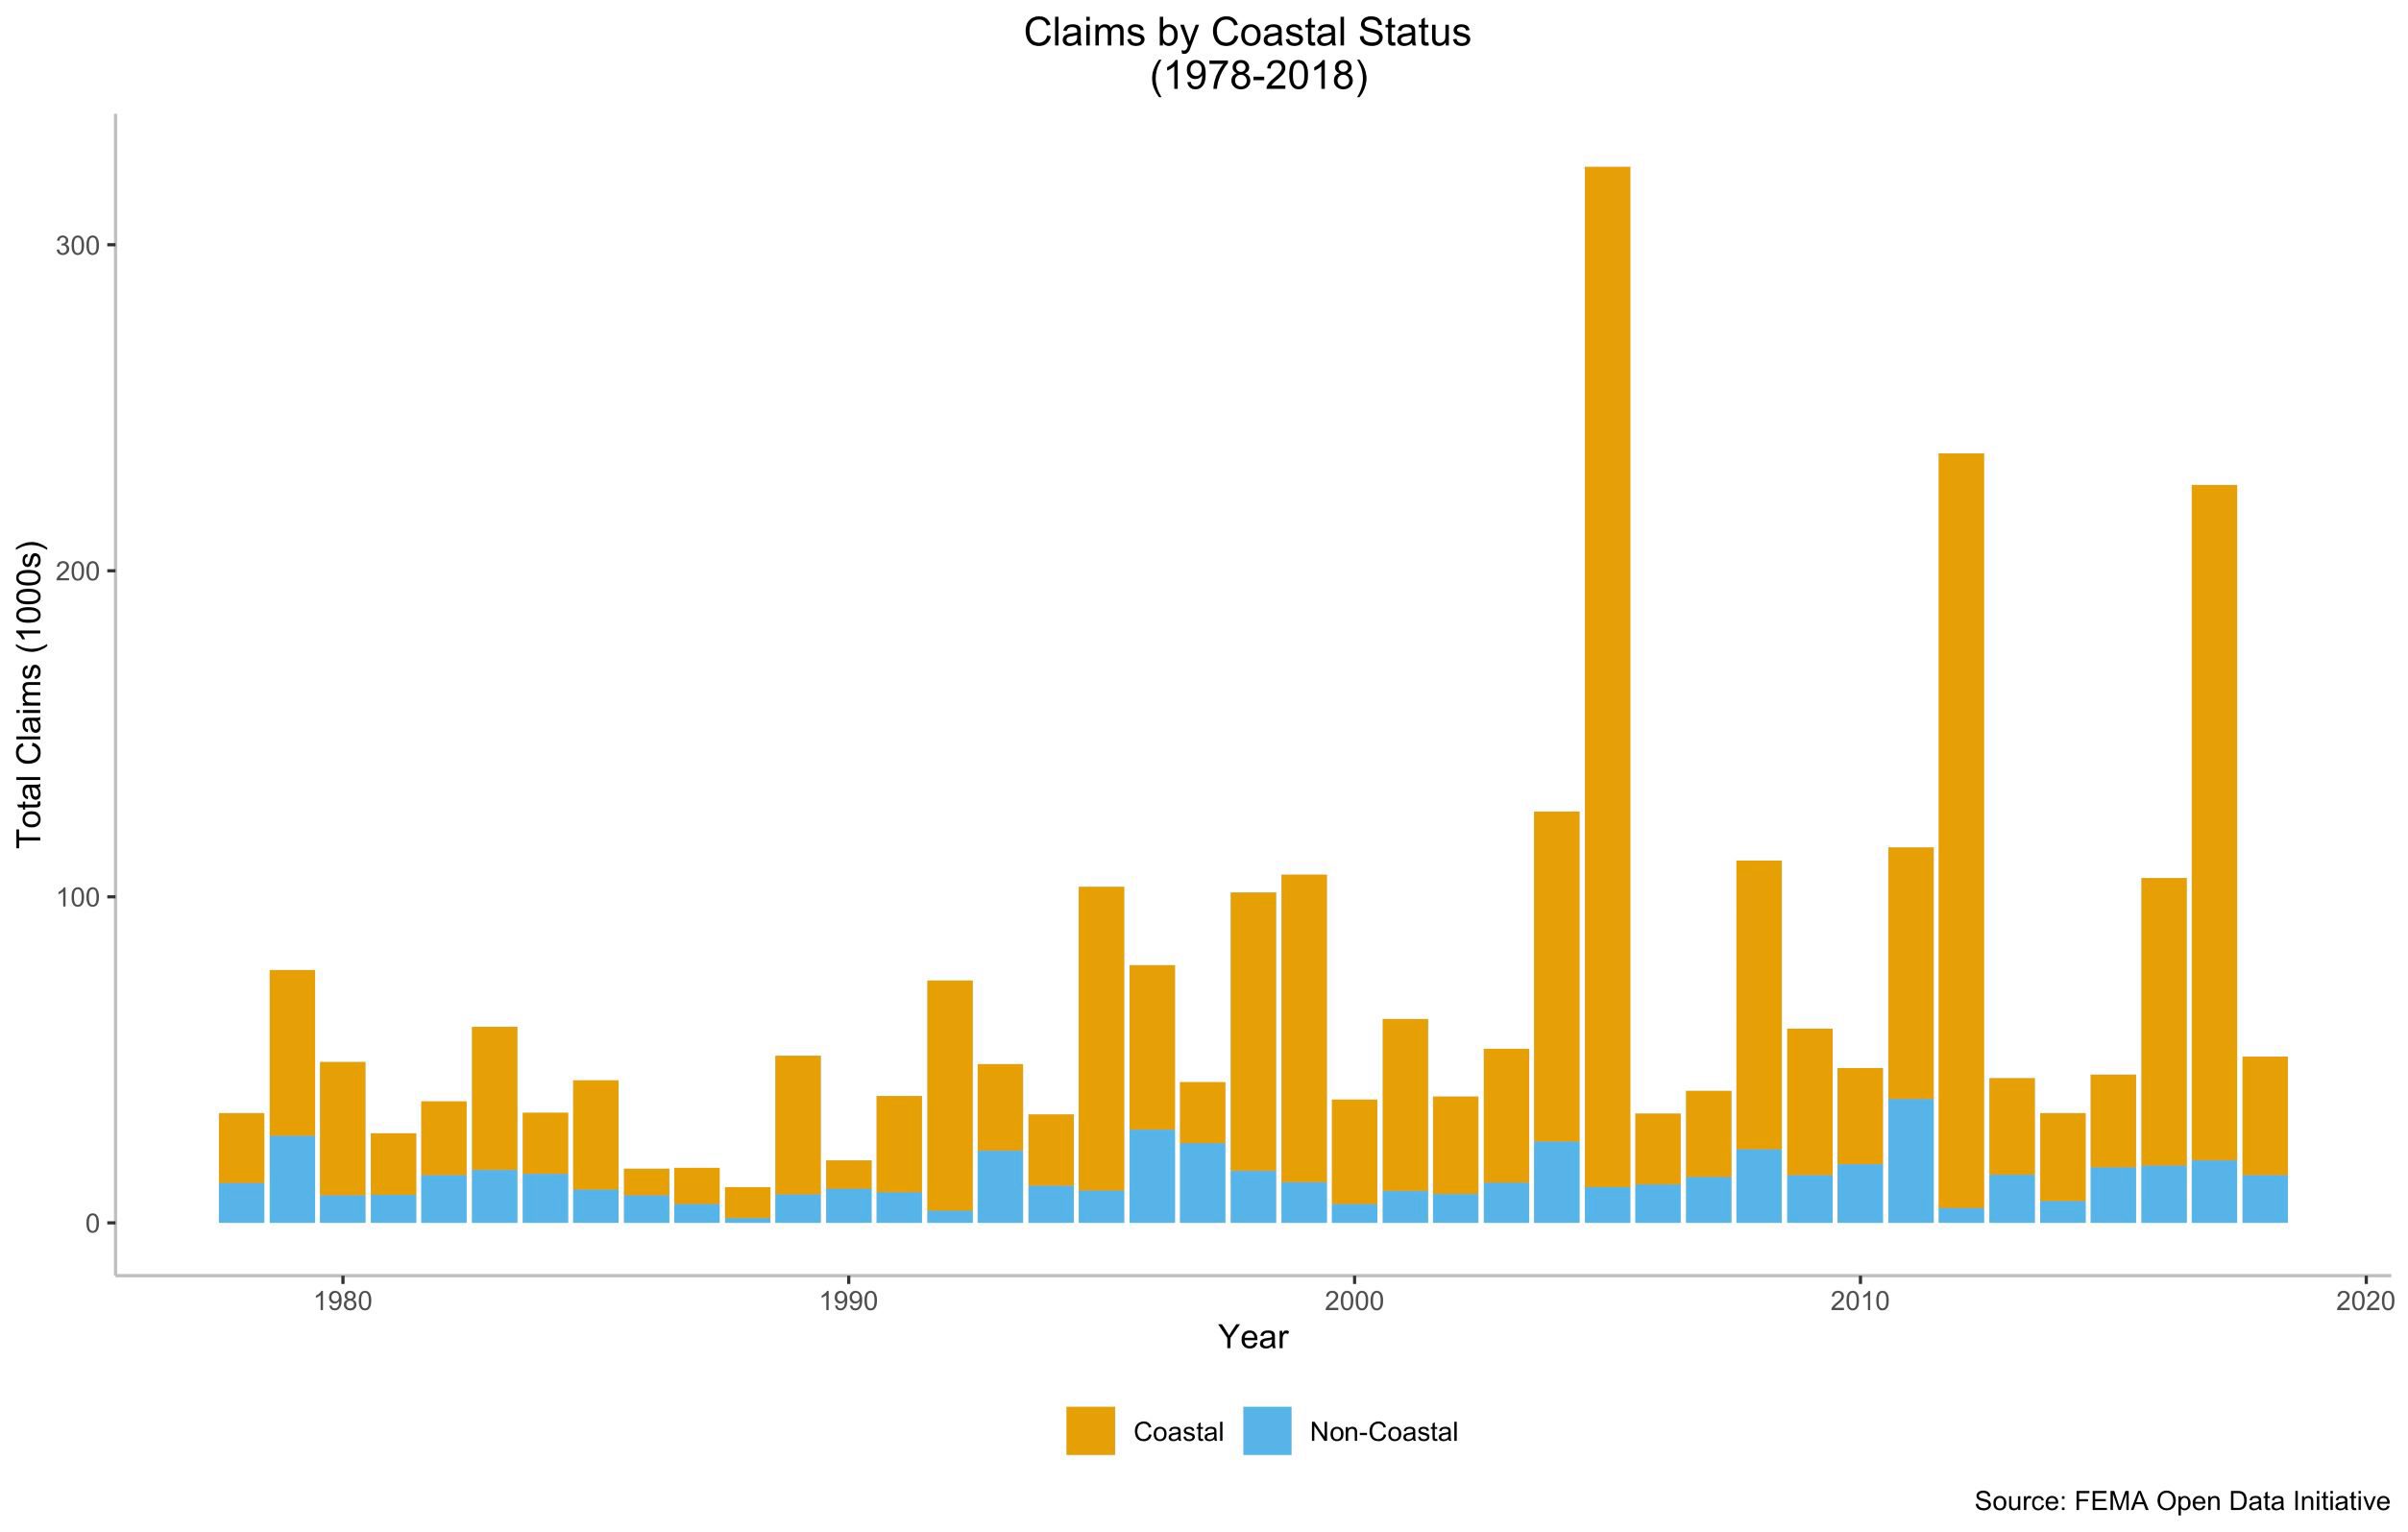
Note: We define a coastal property as one that falls within a county that boarders the U.S. coastline as defined by the U.S. Geological Survey.
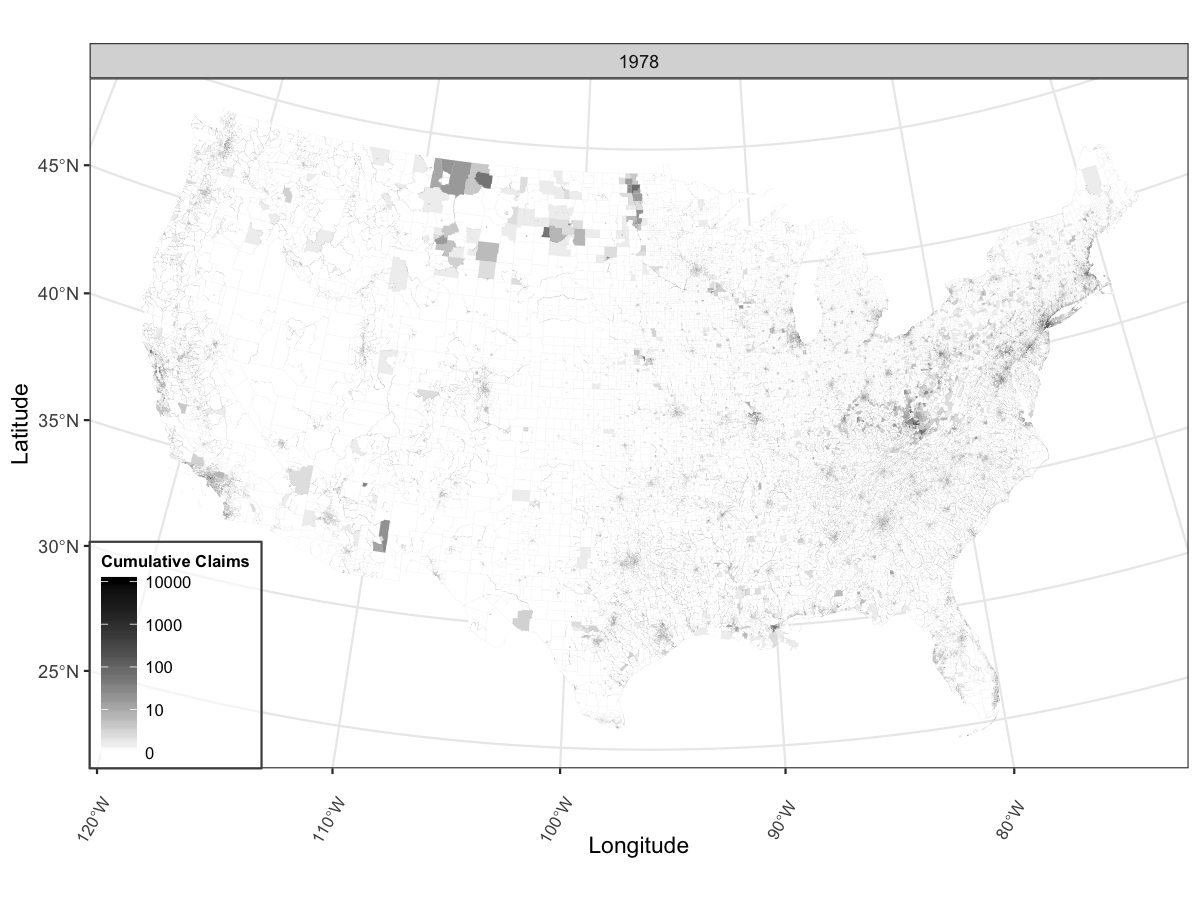
Despite the majority of NFIP policies being located in coastal areas, it is important to remember that flooding can occur anywhere. Severe flooding has occurred on our nation’s rivers and streams and heavy precipitation events cause flooding in communities around the country, even on property far from any river. This is shown in the following animation, which shows cumulative flood claims in the program over time. Higher take-up of flood insurance outside coastal areas would no doubt result in greater NFIP claims payments in the interior of the country.
4. Risk varies more than is communicated to people.
Lenders are required to notify borrowers if their property is located in a Special Flood Hazard Area (SFHA). Some states require that this be disclosed by sellers earlier in the home buying process. But this yes/no communication of risk is often confusing and insufficient. It can create a false sense that flood risk is binary when in reality flood risk varies considerably across a given landscape. The SFHA designation also can fail to incorporate all sources of flood risk, most notably rainfall flooding, and does not speak to potential impacts or losses, which again can vary widely property-by-property. Clearly, our current flood risk communication is insufficient.
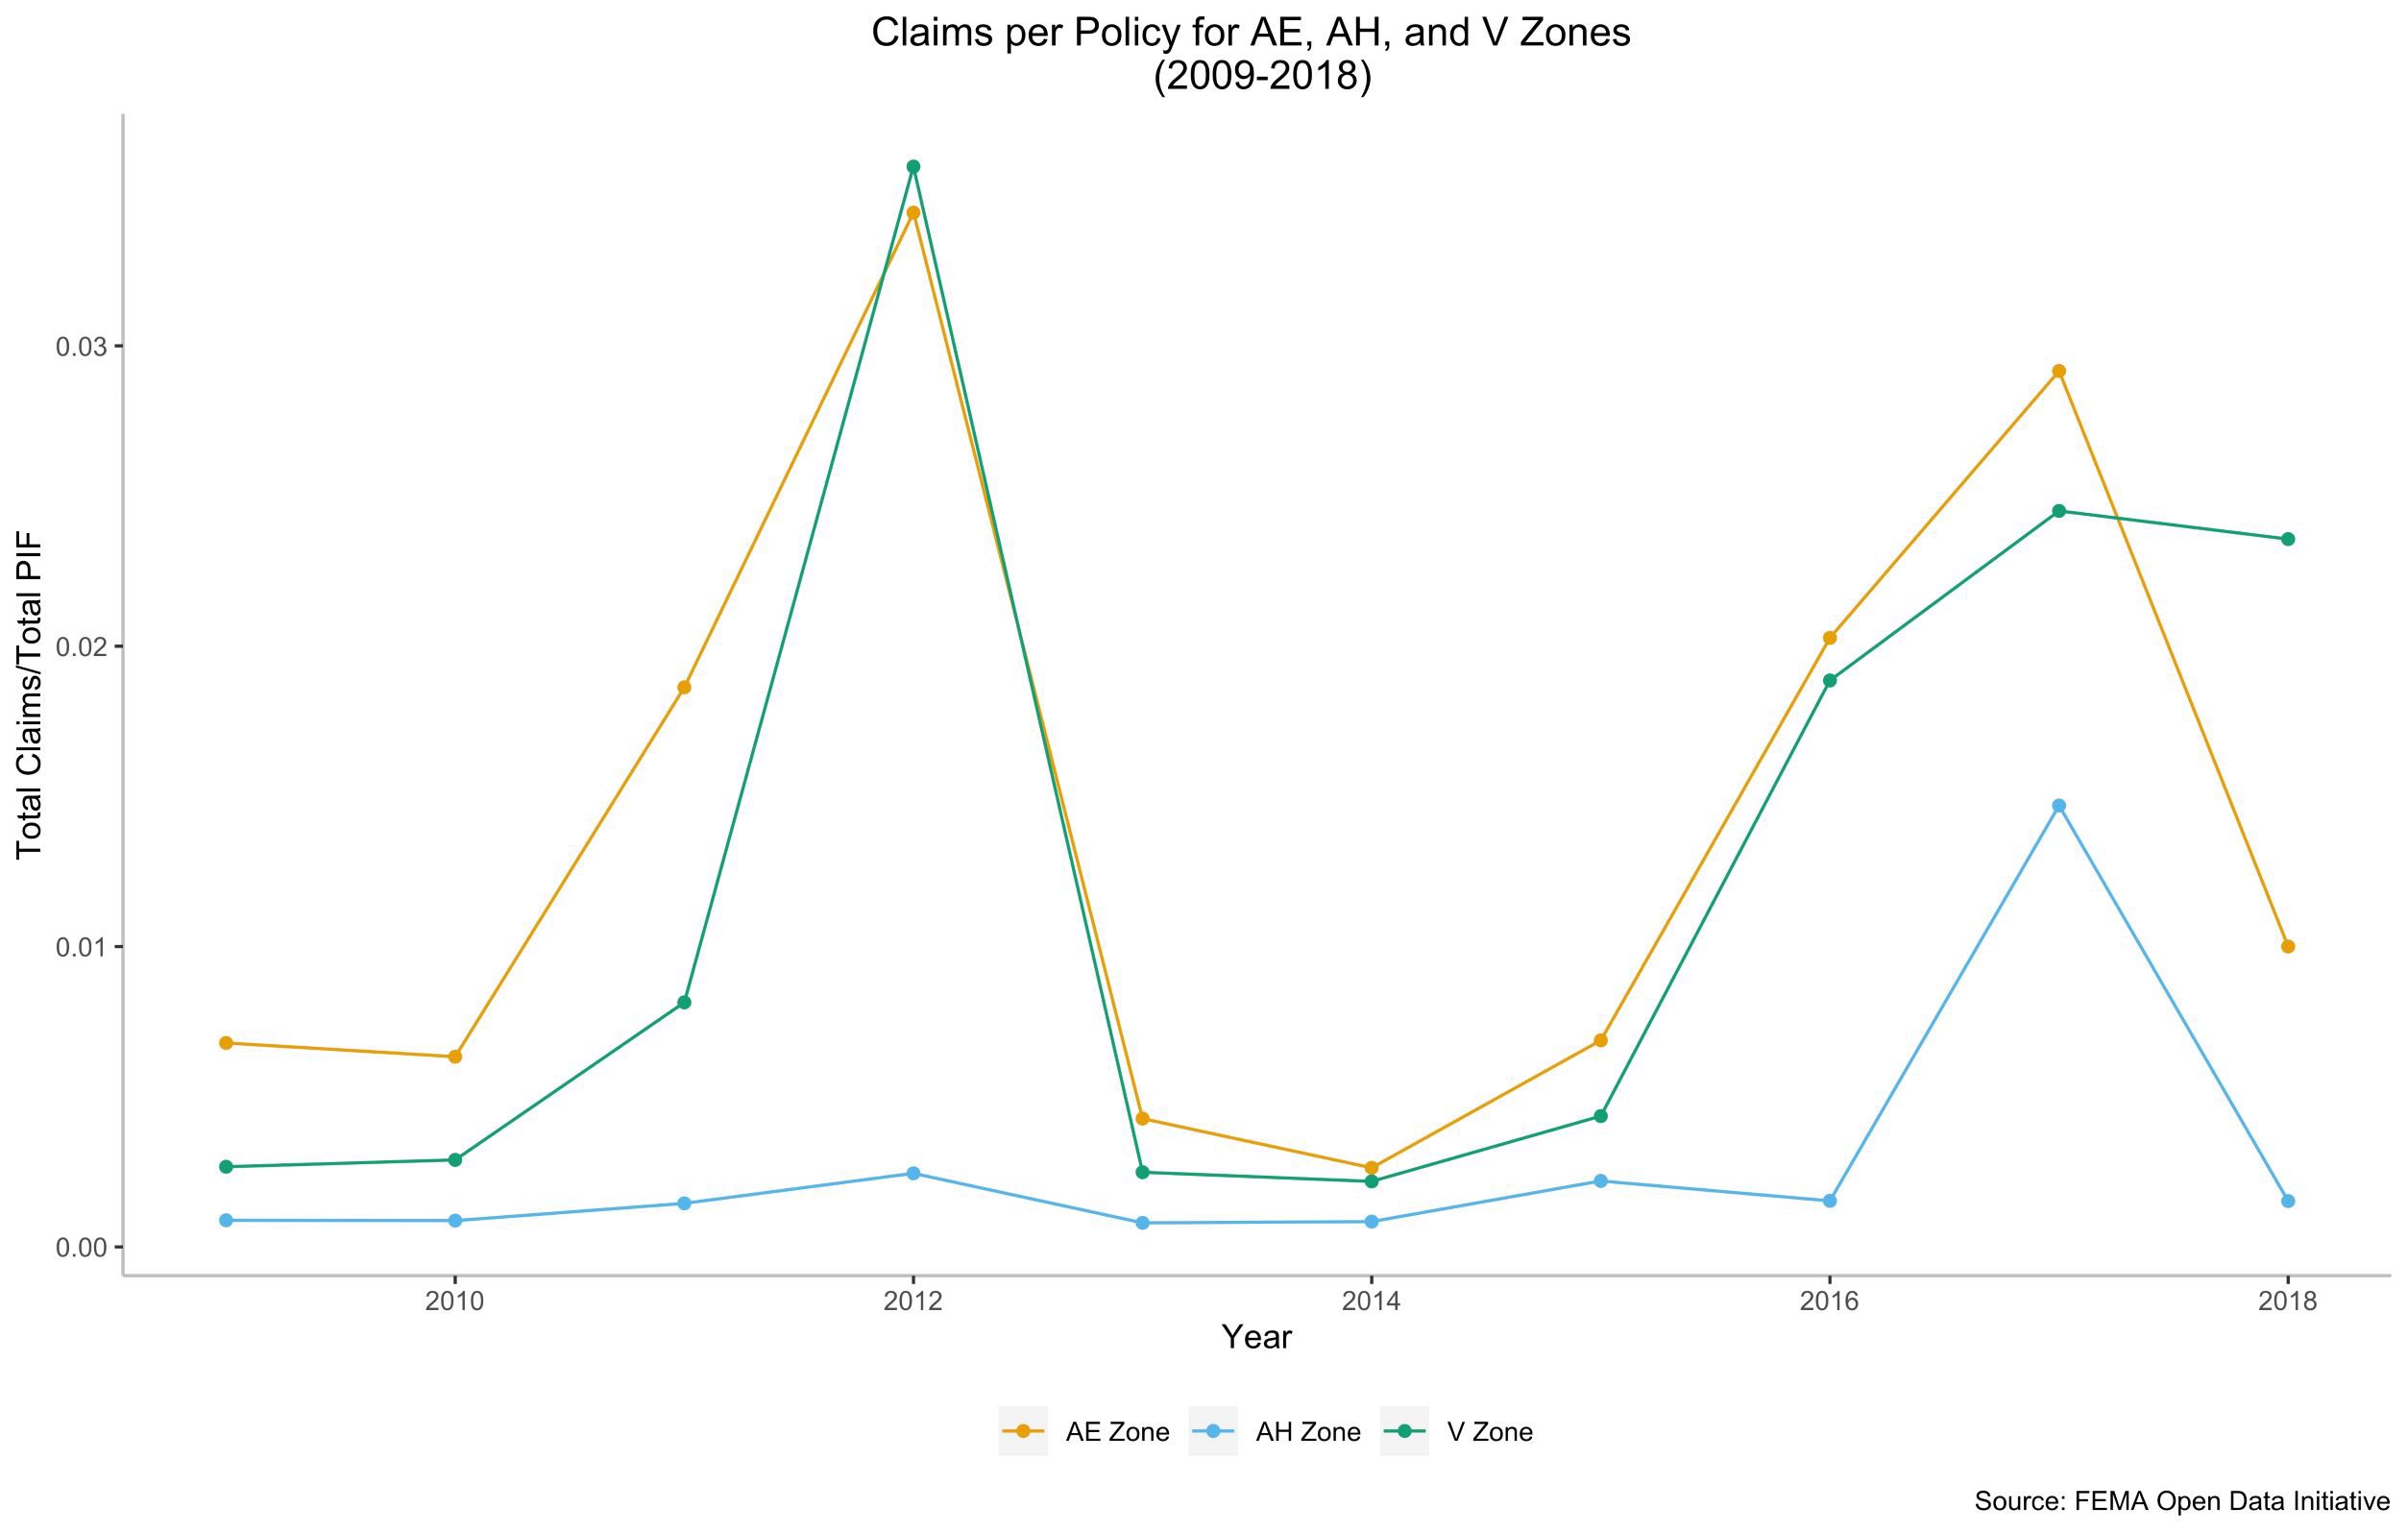
Types of flood risk also vary considerably. For example, the risk from shallow ponding is not the same as the risk from storm surge. While damages from these different types of floods can differ dramatically, claim rates also vary. This can be seen in the below figure, which shows the percent of policies that filed a claim each year from 2009 to 2018 for the AE, AH, and V zones. All of these zones are 100-year floodplains, but AH are areas prone to shallow ponding and V zones are subject to storm surge (breaking waves of at least 3 feet). AH policies experience around 1 claim for every 100 policies on average, while AE/V policies experience around 3 claims for every 100 policies on average. This is three times the rate that is suggested by the “100-year floodplain” or 1% annual flood, since for most of that area, flood frequencies are actually higher.
Beyond the hazard, flood risk is also a function of the actual property. For instance, is a home elevated? Is the crawl-space well-vented? Are the lowest floors made using flood-resistant materials? Is the HVAC unit on higher floors? While many of these details about a property cannot be observed in the NFIP data, we can examine how claims vary along one dimension: pre/post-FIRM. Pre-FIRM properties are those built before FEMA mapped the flooding in an area and are—in theory—more susceptible to experiencing flood-related losses.
Accounting for the number of policies-in-force, pre-FIRM policies appear to experience claims at a higher rate than post-FIRM policies: the ratio of claims to policies for the years 2009 to 2018 suggests that the probability of a pre-FIRM policy experiencing a claim in this period was 2%, compared to a 1.2% probability for post-FIRM policies. Pre-FIRM structures also appear to experience greater damage as a share of coverage amount relative to post-FIRM structures, with claims payments for pre-FIRM structures accounting for 24.2% of the total coverage amount on average and claims payments for post-FIRM structures accounting for 19.2% of the total coverage amount on average.
Going Forward
As flood risk continues to increase in many communities around the country, we will need to improve our risk communication and our flood risk management at all scales. Both can be informed by the increased transparency and improved data analysis made possible by the public release of NFIP data.