Analyzing the progression of conflict in Ukraine: 5 key takeaways
In this month’s blog, we leverage the Wharton ESG Initiative’s Business and Conflict Barometer (BCB) Project to analyze the progression of conflict, sector by sector, in Ukraine since the earliest drastic signs of Russia’s mobilization along the border in early 2021. The Russo-Ukrainian war began in early 2014 and escalated into a widespread and full-scale military invasion on Ukranian soil by Moscow in February 2022. Since then, Russia’s invasion has been internationally condemned and sanctioned amidst thousands of resulting deaths and serious global economic and supply-chain disruptions.
The BCB is a joint initiative of the University of Stellenbosch, Copenhagen Business School, and the Wharton School of the University of Pennsylvania, with funding and support from EY, the Norwegian Research Council, the Bay & Paul Foundations, and Amazon Web Services. In response to the deep fragmentation of data on the private sector, conflict, and development, the BCB allows for the ingestion and analysis of a broad range of data relevant to conflict risk and its mitigation. This includes quantitative data, but also textual corpora that can be analyzed through natural language processing and other machine and artificial learning techniques.
Data analyzed by the BCB results in a “barometer” score of conflict pressures for a particular place and time, measured as coefficients on a scale from -7 (very high conflict pressures) to +7 (no conflict pressures) alongside the topics or themes associated with that conflict. For example, a region or actor experiencing high degrees of conflict (war, government instability, economic damage, etc.) will demonstrate scores below zero, such as -1 and -3, while low or no degrees of conflict (economic prosperity, environmental growth) will show scores above zero, such as 1 or 2. A neutral score of 0 reflects neither high nor low conflict occurrence. Although the scores range from -7 to 7, they are relatively normally distributed, meaning that even a deviation of -2 or 2 is an indicator of significant conflict-related media coverage at the country level.
Key takeaways
The Russo-Ukrainian War demonstrated long-term changes in degrees of conflict stemming from key turning points in the crisis
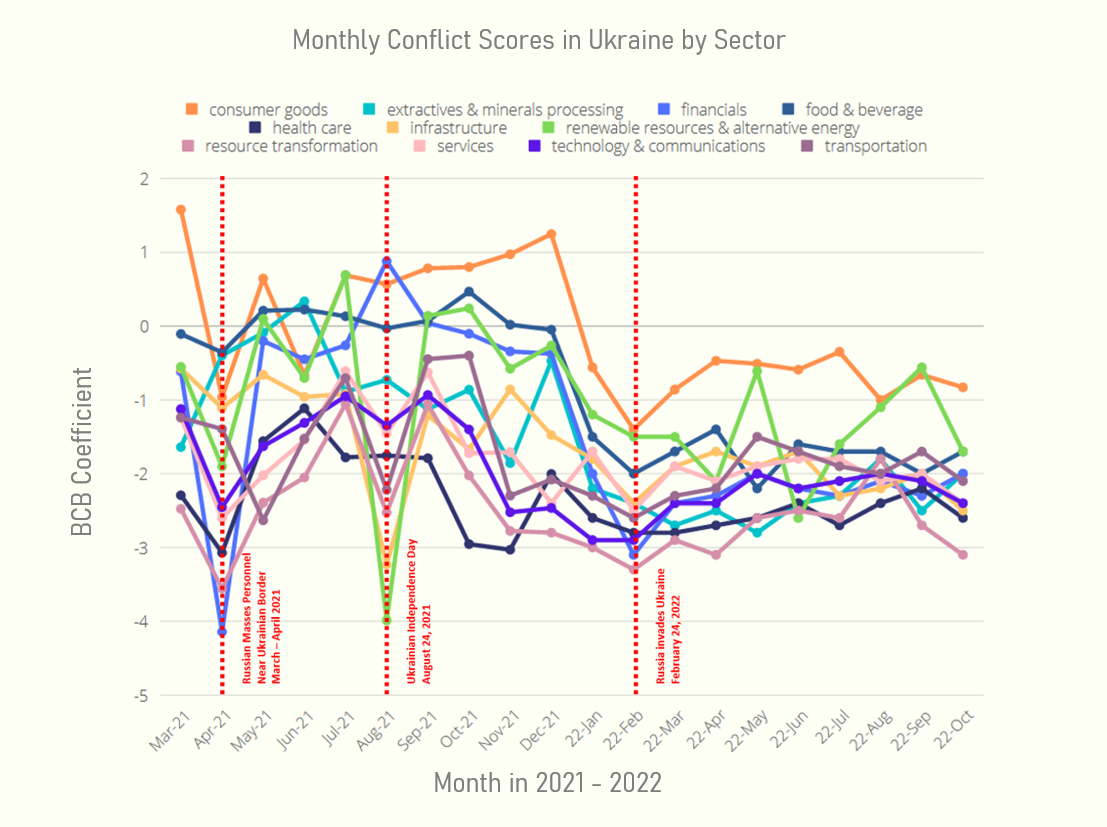
Using the BCB, we can track patterns of the conflict coefficients across the 11 SASB industry-standard sectors, plotted alongside key events in the Russia-Ukraine War (Fig. 1). SASB standards groups industries by sectors for straightforward analysis and comparison of BCB coefficients.

The data demonstrated a plunge in BCB values across most sectors in March and April 2021 when Russia began amassing troops and equipment alongside the Ukrainian border. Since then, conflict coefficients have continued in a downward trend. Resource transformation, a sector that includes both aerospace and defense industries, absorbed the holistically lowest coefficient scores. In April 2021 the industry’s BCB coefficient plunged to -3.6. It began to recover but ten months later in February 2022 plunged back to -3.3 immediately following the Russian invasion.
Two additional timeline events are heavily reflected by stark changes in the BCB data outputs. In 2021, Ukraine’s Independence Day on August 24 triggered its first military parade in years, a strong speech by President Volodymyr Zelensky about the country’s intentions to reclaim the annexed territory, and widespread condemnation of Russia’s military actions by Ukrainian military and government officials. Across all sectors except financials, the BCB showed a sudden drop in the national conflict coefficient, indicating an increase in conflict and urgency nationwide. A year later on August 24th 2022, Ukraine marked six months of war. Coefficients slightly increased, reflecting a decrease in conflict pressures as the UK Prime Minister visited Kyiv, Zelensky announced a new US $3 billion aid package, and the country celebrated a quiet, mock parade focused on its victories in the battlefields that month.
Previously untouched sectors and industries showed increased degrees of conflict ahead of the invasion in early 2022 and have suffered greatly since

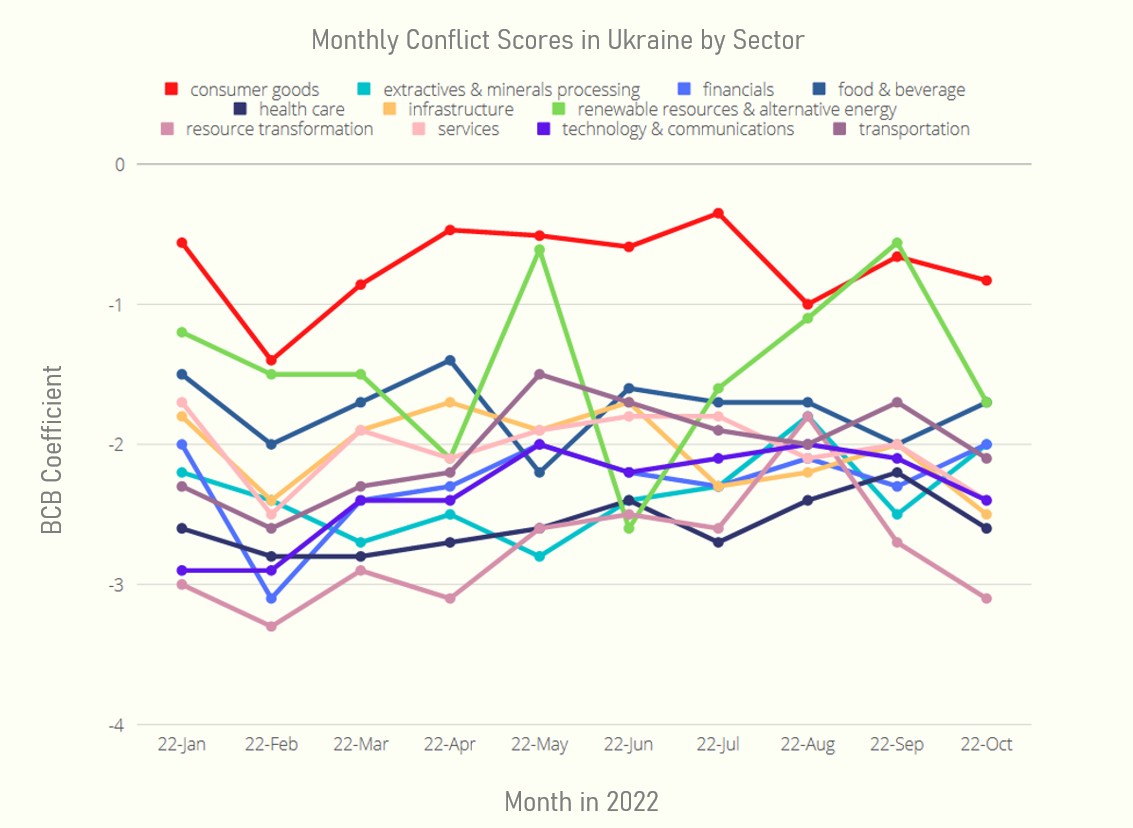
In anticipation of Russia’s invasion on February 24, 2022, scores for all sectors progressively plummeted until January 2022 (Fig. 2). Upon Russia’s invasion, coefficients plunged yet again, and unlike other previous geopolitical shocks in the timeline, have not recovered since. All sectors, including consumer goods, have mostly continued to waver with coefficients between -3 and -1 until November 2022, with a progressively negative trend again since September 2022. Consumer goods, which generally demonstrate positive scores for over 90% of countries sampled by the BCB, have remained below 0 since the start of the year, while financials have collapsed between November 2021 and February 2022.
Russia and Ukraine showed extreme degrees of global conflict scores
Most recently, in late 2022, Russia’s war in Ukraine continued to wear down Ukraine’s resources and severely affected coefficient scores for political allies and regional politics on both sides. In October 2022, Ukraine and Russia remained two of the few conflict-stricken countries across all BCB outputs with neutral or negative scores across every sector. Ukraine and Russia had resource transformation scores of -2.7 and -3.1 respectively, indicating a continuation of severe military conflict[1]. Ukraine saw a slight improvement in scores across only 3 of the 11 sectors, with progressively worsening extractives and minerals processing. This carries big geopolitical risk because, “Ukraine has deposits of 117 of the 120 most widely used minerals and metals. At least 40 of them are needed for the green transition. It is a resource superpower,” according to the Financial Times.
[1] It is important to note that the resource transformation sector is almost always negative for all countries since it harbors many industries often connected to large-scale conflict. However, the absolute value and trend of the coefficient indicate significant changes in the degree of conflict in the country-level analysis.
The BCB helps visualize the impacts of conflict at an industry level of analysis, specifically for energy-related industries
At a sector-specific level, much of the conversation surrounding the impacts of the war in Ukraine in Western Europe over the past year has surrounded various energy sectors. Our BCB data demonstrate two particular patterns. Firstly, the traditional oil and gas industries (refining, producing, services) are housed in the “Extractive and Minerals Processing” category, pictured in Figure 1 in the teal-colored line depicting continuously negative. The exception to this negative trend, pictured as an uptick in conflict coefficients between November to December 2021 is linked to widespread speculation about the potential of Russia’s Nord Stream 2 Pipeline. The renewables sector has also received significant attention, as countries in Western Europe struggle to secure energy resources amidst damaged supply chains. The region’s energy crisis is marked by rising costs and increasingly difficult geopolitical conditions linked to the war in Ukraine. In our data negative values for this sector have persisted, albeit with a slight improvement to the coefficient in May 2022 when plans for better renewable energy programs in the EU were announced by both UN Secretary-General Antonio Guterres and German government officials.
Using geographic visuals, the BCB portrayed regional conflict spillover
The war in Ukraine has also demonstrated the use of the BCB as a helpful visualizer of conflict spillover into neighboring countries in the region. Of the seven countries bordering Ukraine (Hungary, Poland, Moldova, Romania, Russia, Slovakia, and Belarus), all but Romania [which had a coefficient close to 0] showed negative coefficients across most sectors, most notably the resource transformation sectors in October 2022.


